目录
- 参考
- 一、启动
- 二、支持的ognl表达式
- 三、监听参数
- 监听Controller 的参数和返回值
- 监听完整参数和返回值
- 监听kafka消费
- 监听单个参数
- 监听异常
- 按照耗时进行过滤
- 监听参数比较
- 四、变量和方法
- 查询静态成员变量值
- 查询配置类具体属性的值
- 通过类加载器查看Spring容器中对象所有属性
- 执行静态方法
- 五、反编译
- 六、修改logLevel日志等级
- 查看类的类加载器
- 用ognl获取logger
- 设置level
- 单独设置DeviceController的logger level
- 修改logback的全局logger level(不建议使用)
- 通过logger修改logback的日志级别对应yml中logging的日志级别
- 七、退出
- 八、cpu过高,线程死锁实战
- 参考
- 测试代码
- 查看线程
- 查看cpu过高线程堆栈
- 线程池死锁问题排查
- 查看线程死锁
- 反编译
- 查看变量的值
- 九、跟踪 Http 请求小技巧
- 1、 获取接口的响应时间
- 2、获取指定header 头的信息
- 十、接口耗时
- 十一、arthas 简单查看 sql 语句
- 方法一:watch Connection
- 方法二:watch BoundSql
参考
Alibaba开源的Java诊断工具Arthas-进阶教程
爱上Java诊断利器Arthas
arthas-idea-plugin
用户实战
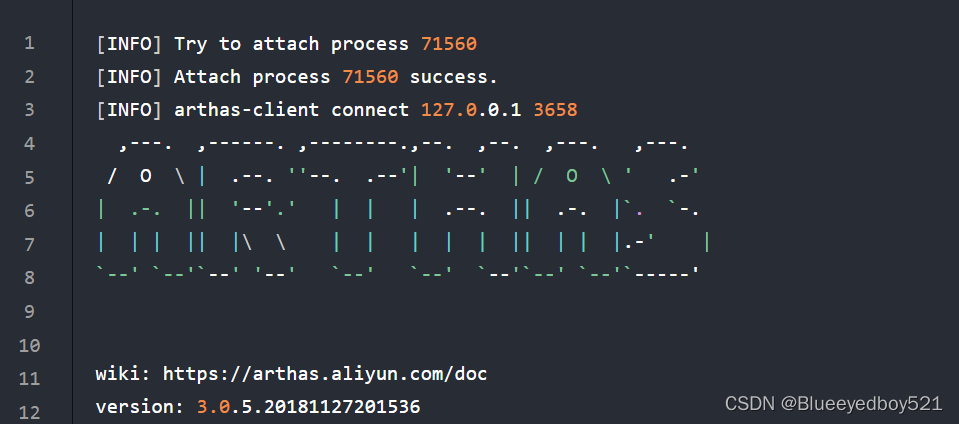
一、启动
# 避免中文乱码
wget https://arthas.aliyun.com/arthas-boot.jar;java -jar arthas-boot.jar --target-ip 0.0.0.0
java -Dfile.encoding=UTF-8 -jar arthas-boot.jar
二、支持的ognl表达式
- loader
- clazz
- method
- target
- params
- returnObj
- throwExp
- isBefore
- isThrow
- isReturn
三、监听参数
# 监听所有参数
watch com.xxx.iot.web.DeviceController * '{params}' -x 2
# 监听所有参数
watch com.xxx.iot.web.DeviceController * params -x 2
# 监听第几个参数
watch com.xxx.iot.web.DeviceController * params[0] -x 2
-x表示遍历深度,可以调整来打印具体的参数和结果内容,默认值是1。
监听Controller 的参数和返回值
监听完整参数和返回值
# 只监听参数
watch com.xxx.iot.web.DeviceController * '{params}' -x 2
# 或者
watch com.xxx.iot.web.DeviceController * params -x 2
# 监听所有方法
watch com.xxx.iot.web.DeviceController * '{params, target, returnObj}' -x 2
# 监听对应方法
watch com.xxx.iot.web.DeviceController getOnlineByCode '{params, target, returnObj}' -x 2
当请求如下时
java">Result<PageDTO<DriverDTO>> fetchDriverByDeviceCode(@Validated @Parameter(description = "实体", name = "param", required = true) @RequestBody DevicePageQueryDTO param)

arthas显示如下:
method=com.xxx.iot.web.DeviceController.getOnlineByCode location=AtExit
ts=2023-04-10 16:57:49; [cost=16.8166ms] result=@ArrayList[
@Object[][
@DeviceCodeBatchQueryDTO[DeviceCodeBatchQueryDTO(deviceCodes=[1584381959985602561, 1589581864182480897, 150077101, TJ0205103, TJ0205211])],
],
@DeviceController[
log=@Logger[Logger[com.xxx.iot.web.DeviceController]],
deviceService=@DeviceServiceImpl[com.xxx.iot.service.impl.DeviceServiceImpl@5236007a],
],
@Result[
serialVersionUID=@Long[1],
traceId=null,
code=@Integer[0],
msg=null,
data=@ArrayList[isEmpty=false;size=5],
uri=null,
],
]
监听kafka消费
# 方法 public void process(JSONObject messageBody,PhysicalDataModelDTO tdl,DeviceType deviceType,ProductDTO product,String productKey,String deviceKey, String messageId,String deviceMessageId) {)
watch com.xxx.iot.receiver.listener.KafkaPropertyReceiver process '{params, target, returnObj}' -x 2
监听单个参数
watch com.xxx.iot.receiver.listener.KafkaPropertyReceiver process '{params[0], target, returnObj}' -x 2
效果如下:
method=com.xxx.xxx.receiver.listener.KafkaPropertyReceiver.process location=AtExit
ts=2023-04-10 17:14:30; [cost=24.4472ms] result=@ArrayList[
    @JSONObject[
        @String[deviceKey]:@String[yangchen1],
        @String[messageId]:@String[54691],
        @String[params]:@JSONObject[isEmpty=false;size=11],
        @String[productKey]:@String[cu9f6bf82fc4444cc18774f2bc7d370685],
        @String[ts]:@Long[1681118069925],
        @String[version]:@String[1.0],
    ],
    @KafkaPropertyReceiver[
        log=@Logger[Logger[com.xxx.iot.receiver.listener.KafkaPropertyReceiver]],
        pushService=@PushServiceImpl[com.xxx.iot.push.impl.PushServiceImpl@1703b898],
        mongoTemplate=@MongoTemplate[org.springframework.data.mongodb.core.MongoTemplate@13857408],
        PARAMS=@String[params],
        productService=@ProductServiceImpl[com.xxx.iot.service.impl.ProductServiceImpl@196a3471],
        log=@Logger[Logger[com.xxx.iot.receiver.listener.KafkaPropertyReceiver]],
        title=@String[属性上报],
    ],
    null,
]
监听异常
watch命令支持-e选项,表示只捕获抛出异常时的请求:
watch com.example.demo.arthas.user.UserController * "{params[0],throwExp}" -e
按照耗时进行过滤
watch命令支持按请求耗时进行过滤,比如:
watch com.example.demo.arthas.user.UserController * '{params, returnObj}' '#cost>200'
监听参数比较
当访问 user/1 时,watch命令没有输出
当访问 user/101 时,watch会打印出结果。
watch com.example.demo.arthas.user.UserController * returnObj 'params[0] > 100'
四、变量和方法
查询静态成员变量值
ognl @com.xxx.iot.ArthasTest@hashSet
查询配置类具体属性的值
## 方法一
ognl '@com.xxx.common.core.util.ServiceHelper@getBean("mqConfig").eventConcurrency'
通过类加载器查看Spring容器中对象所有属性
# 1、获取类加载器
[arthas@17860]$ sc -d *MqConfig | grep class-loader
class-loader      +-sun.misc.Launcher$AppClassLoader@18b4aac2
# 2、获取对象属性
[arthas@17860]$ vmtool --action getInstances -c 18b4aac2 --className com.xxx.iot.mq.config.MqConfig  --limit 10 -x 2
@MqConfig[][
    @MqConfig[
        propertyConcurrency=@Integer[3],
        eventConcurrency=@Integer[1],
    ],
    @MqConfig$$EnhancerBySpringCGLIB$$1[
- -c [类加载器的hash]
- -x 设置层级
# 设置x = 2 无法查看具体
[arthas@7]$ vmtool --action getInstances -c 31221be2 --className com.xxx.iot.config.IotConfig --limit 10 -x 2
@IotConfig[][
    @IotConfig[
        timeout=@Integer[10],
        whiteList=@LinkedHashSet[isEmpty=false;size=3],
        aiProductKey=@String[cu623ef0a8e8564602b464b8021d30f9ab],
        aiHost=@String[172.17.0.1,1xx.x0.2x4.xx7],
        apps=@ArrayList[isEmpty=false;size=4],
    ],

# 设置x = 3 可以查看第二层数据
[arthas@7]$ vmtool --action getInstances -c 31221be2 --className com.xxx.iot.config.IotConfig --limit 10 -x 3
@IotConfig[][
    @IotConfig[
        timeout=@Integer[10],
        whiteList=@LinkedHashSet[
            @String[1xx.x0.2x4.xx7],
            @String[127.0.0.1],
        ],
        aiProductKey=@String[cu623ef0a8e8564602b464b8021d30f9ab],
        aiHost=@String[172.17.0.1,1xx.x0.2x4.xx7],
        apps=@ArrayList[
            @AppDTO[AppDTO(title=null, appKey=12201, appSecret=12301, whiteList=null)],
            @AppDTO[AppDTO(title=null, appKey=33, appSecret=23342, whiteList=null)],
            @AppDTO[AppDTO(title=本地测试, appKey=158173395456, appSecret=O0x7M7TE6AjDsUqxIfZ8zg0Y, whiteList=[127.0.0.1, 192.168.0.44, 192.168.0.88 ])],
            @AppDTO[AppDTO(title=xx信息, appKey=637173395456, appSecret=O0x7M7T6AjwrerwsdX8xgXa, whiteList=[127.0.0.1, 192.168.0.44, 192.168.0.88])],
        ],
    ]
执行静态方法
# 1、获取类加载的hash
sc -d com.xxx.iot.util.IotCacheUtil
# 2、执行带参数
ognl -c 18b4aac2 '@com.xxx.iot.util.IotCacheUtil@getTdl("cu623ef0a8e8564602b464b8021d30f9ab")' -x 4
五、反编译
jad com.example.demo.arthas.user.UserController
# 反编译到制定文件
jad --source-only com.example.demo.arthas.user.UserController > /tmp/UserController.java
六、修改logLevel日志等级
查看类的类加载器
# 下面是模糊查找,也可以精确查找sc -d com.xxx.iot.web.DeviceController | grep class-loader
[arthas@17860]$ sc -d *DeviceController | grep class-loader
 class-loader      +-sun.misc.Launcher$AppClassLoader@18b4aac2
 class-loader      +-sun.misc.Launcher$AppClassLoader@18b4aac2
用ognl获取logger
[arthas@17860]$ ognl --classLoaderClass sun.misc.Launcher$AppClassLoader '@com.xxx.iot.web.DeviceController@log'
@Logger[
    serialVersionUID=@Long[5454405123156820674],
    FQCN=@String[ch.qos.logback.classic.Logger],
    name=@String[com.xxx.iot.web.DeviceController],
    level=null,
    effectiveLevelInt=@Integer[10000],
    parent=@Logger[Logger[com.xxx.iot.web]],
    childrenList=null,
    aai=null,
    additive=@Boolean[true],
    loggerContext=@LoggerContext[ch.qos.logback.classic.LoggerContext[logback]],
    lastUpdateCheckTime=@Long[1681119603828],
]
可以知道DeviceController@logger实际使用的是logback。可以看到level=null,则说明实际最终的level是从root logger里来的。
设置level
单独设置DeviceController的logger level
ognl --classLoaderClass sun.misc.Launcher$AppClassLoader '@com.xxx.iot.web.DeviceController@log.setLevel(@ch.qos.logback.classic.Level@DEBUG)'
再次获取DeviceController@logger,可以发现已经是DEBUG了:
[arthas@17860]$ ognl --classLoaderClass sun.misc.Launcher$AppClassLoader '@com.xxx.iot.web.DeviceController@lo'
@Logger[
    serialVersionUID=@Long[5454405123156820674],
    FQCN=@String[ch.qos.logback.classic.Logger],
    name=@String[com.xxx.iot.web.DeviceController],
    level=@Level[DEBUG],
    effectiveLevelInt=@Integer[10000],
    parent=@Logger[Logger[com.xxx.iot.web]],
    childrenList=null,
    aai=null,
    additive=@Boolean[true],
    loggerContext=@LoggerContext[ch.qos.logback.classic.LoggerContext[logback]],
    lastUpdateCheckTime=@Long[1681119814259],
]
修改logback的全局logger level(不建议使用)
通过获取root logger,可以修改全局的logger level:
ognl --classLoaderClass sun.misc.Launcher$AppClassLoader '@org.slf4j.LoggerFactory@getLogger("root").setLevel(@ch.qos.logback.classic.Level@DEBUG)'
通过logger修改logback的日志级别对应yml中logging的日志级别
logging:
  level:
    org.springframework.data.mongodb.core.MongoTemplate: DEBUG
修改为info
# 查看日志级别
logger --name org.springframework.data.mongodb.core.MongoTemplate
# 修改
logger --name org.springframework.data.mongodb.core.MongoTemplate --level info
七、退出
# 退出当前监听
exit
# 退出整个程序
stop
八、cpu过高,线程死锁实战
参考
利用Arthas精准定位Java应用CPU负载过高问题#1202
测试代码
java">public class ArthasTest {
    private static HashSet hashSet = new HashSet();

    public static void main(String[] args) {
        // 模拟 CPU 过高
        cpuHigh();
        // 模拟线程死锁
        deadThread();
        // 不断的向 hashSet 集合增加数据
        addHashSetThread();
    }

    /**
     * 不断的向 hashSet 集合添加数据
     */
    public static void addHashSetThread() {
// 初始化常量
        new Thread(() -> {
            int count = 0;
            while (true) {
                try {
                    hashSet.add("count" + count);
                    Thread.sleep(1000);
                    count++;
                } catch (InterruptedException e) {
                    e.printStackTrace();
                }
            }
        }).start();
    }

    public static void cpuHigh() {
        new Thread(() -> {
            while (true) {

            }
        }).start();
    }

    /**
     * 死锁
     */
    private static void deadThread() {
        /** 创建资源 */
        Object resourceA = new Object();
        Object resourceB = new Object();
        // 创建线程
        Thread threadA = new Thread(() -> {
            synchronized (resourceA) {
                System.out.println(Thread.currentThread() + " get ResourceA");
                try {
                    Thread.sleep(1000);
                } catch (InterruptedException e) {
                    e.printStackTrace();
                }
                System.out.println(Thread.currentThread() + "waiting get resourceB");
                synchronized (resourceB) {
                    System.out.println(Thread.currentThread() + " get resourceB");
                }
            }
        });

        Thread threadB = new Thread(() -> {
            synchronized (resourceB) {
                System.out.println(Thread.currentThread() + " get ResourceB");
                try {
                    Thread.sleep(1000);
                } catch (InterruptedException e) {
                    e.printStackTrace();
                }
                System.out.println(Thread.currentThread() + "waiting get resourceA");
                synchronized (resourceA) {
                    System.out.println(Thread.currentThread() + " get resourceA");
                }
            }
        });
        threadA.start();
        threadB.start();
    }
}
查看线程
thread
Threads Total: 49, NEW: 0, RUNNABLE: 9, BLOCKED: 2, WAITING: 4, TIMED_WAITING: 4, TERMINATED: 0, Internal threads: 30
ID   NAME                          GROUP          PRIORITY  STATE    %CPU      DELTA_TIM TIME      INTERRUPT DAEMON
22   Thread-0                      main           5         RUNNABLE 65.65     0.140     0:41.265  false     false
2    Reference Handler             system         10        WAITING  0.0       0.000     0:0.000   false     true
3    Finalizer                     system         8         WAITING  0.0       0.000     0:0.000   false     true
4    Signal Dispatcher             system         9         RUNNABLE 0.0       0.000     0:0.000   false     true
5    Attach Listener               system         5         RUNNABLE 0.0       0.000     0:0.015   false     true
28   arthas-timer                  system         5         WAITING  0.0       0.000     0:0.000   false     true
30   Keep-Alive-Timer              system         8         TIMED_WA 0.0       0.000     0:0.000   false     true
31   arthas-NettyHttpTelnetBootstr system         5         RUNNABLE 0.0       0.000     0:0.000   false     true
32   arthas-NettyWebsocketTtyBoots system         5         RUNNABLE 0.0       0.000     0:0.000   false     true
33   arthas-NettyWebsocketTtyBoots system         5         RUNNABLE 0.0       0.000     0:0.000   false     true
34   arthas-shell-server           system         5         TIMED_WA 0.0       0.000     0:0.000   false     true
35   arthas-session-manager        system         5         TIMED_WA 0.0       0.000     0:0.000   false     true
36   arthas-UserStat               system         5         WAITING  0.0       0.000     0:0.000   false     true
38   arthas-NettyHttpTelnetBootstr system         5         RUNNABLE 0.0       0.000     0:0.000   false     true
39   arthas-command-execute        system         5         RUNNABLE 0.0       0.000     0:0.000   false     true
23   Thread-1                      main           5         BLOCKED  0.0       0.000     0:0.000   false     false
24   Thread-2                      main           5         BLOCKED  0.0       0.000     0:0.000   false     false
25   Thread-3                      main           5         TIMED_WA 0.0       0.000     0:0.000   false     false
26   DestroyJavaVM                 main           5         RUNNABLE 0.0       0.000     0:0.046   false     false
-1   Service Thread                -              -1        -        0.0       0.000     0:0.000   false     true
-1   C1 CompilerThread9            -              -1        -        0.0       0.000     0:0.031   false     true
-1   C1 CompilerThread8            -              -1        -        0.0       0.000     0:0.000   false     true
-1   C1 CompilerThread10           -              -1        -        0.0       0.000     0:0.015   false     true
-1   C1 CompilerThread11           -              -1        -        0.0       0.000     0:0.000   false     true
-1   GC task thread#11 (ParallelGC -              -1        -        0.0       0.000     0:0.000   false     true
-1   GC task thread#10 (ParallelGC -              -1        -        0.0       0.000     0:0.000   false     true
-1   C2 CompilerThread2
查看cpu过高线程堆栈
[arthas@1948]$ thread 22
"Thread-0" Id=22 RUNNABLE
    at com.xxx.iot.ArthasTest.lambda$cpuHigh$1(ArthasTest.java:42)
    at com.xxx.iot.ArthasTest$$Lambda$1/1711574013.run(Unknown Source)
    at java.lang.Thread.run(Thread.java:748)
线程池死锁问题排查
thread --state BLOCKED
查看线程死锁
[arthas@1948]$ thread -b
"Thread-1" Id=23 BLOCKED on java.lang.Object@4db472ec owned by "Thread-2" Id=24
    at com.xxx.iot.ArthasTest.lambda$deadThread$2(ArthasTest.java:66)
    -  blocked on java.lang.Object@4db472ec
    -  locked java.lang.Object@5e0c9ecd <---- but blocks 1 other threads!
    at com.xxx.iot.ArthasTest$$Lambda$2/1674896058.run(Unknown Source)
    at java.lang.Thread.run(Thread.java:748)
反编译
[arthas@1948]$ jad com.xxx.iot.ArthasTest
查看变量的值
ognl @com.xxx.iot.ArthasTest@hashSet
九、跟踪 Http 请求小技巧
1、 获取接口的响应时间
刚刚朋友需要分析所有的请求接口的耗时 通过arthas 分析,分享给大家
可以通过从定向打印到文件 然后根据响应格式进行统计分析
watch org.springframework.web.servlet.DispatcherServlet doService '{params[0].getRequestURI()+" "+params[0].getRemoteAddr()+" "+ #cost}' -n 5 -x 3 '#cost>100' -f
2、获取指定header 头的信息
比如这里 获取 trace-id
 watch org.springframework.web.servlet.DispatcherServlet doService '{params[0].getRequestURI()+"  header="+params[0].getHeaders("User-Agent")}'  -n 10  -x 3 -f

 watch org.springframework.web.servlet.DispatcherServlet doService '{params[0].getRequestURI()+ " " +params[0].getRemoteAddr() +"  header="+params[0].getHeader("x-forwarded-for")}'  -n 10  -x 3 -f

 watch com.xxx.iot.interceptor.IotApiInterceptor preHandle '{params[0].getRequestURI()+ " " +params[0].getRemoteAddr() +"  header="+params[0].getHeaders("x-forwarded-for")}'  -n 10  -x 3 -f
十、接口耗时
接口耗时分析
一般我们使用arthas 进行接口具体的耗时分析 还可以结合 skyworking等分布式追踪框架查看耗时。
第一步 查看具体的接口的耗时,需要多个类 -E 一起使用
trace com.wangji92.arthas.plugin.demo.service.impl.ArthasTestServiceImpl doTraceE -n 5 --skipJDKMethod true
第一步 可能只关系耗时大于多少的进行分析 (项目优化批量进行捕捉分析耗时的位置,也可以采用"盲"匹配)
trace com.xxxCompany* * '#cost > 2000'
十一、arthas 简单查看 sql 语句
下面的两种思路查看基本的sql 构造基本可用~ 还可以增加 条件表达式进行过滤一下参数
方法一:watch Connection
直接watch Connection 查看sql 这个可以满足基本的需求,没有执行参数的信息。
watch java.sql.Connection prepareStatement '{params,throwExp}' -n 5 -x 3
方法二:watch BoundSql
使用了mybatis 可以使用
watch org.apache.ibatis.mapping.BoundSql getSql '{params,returnObj,throwExp}' -n 5 -x 3